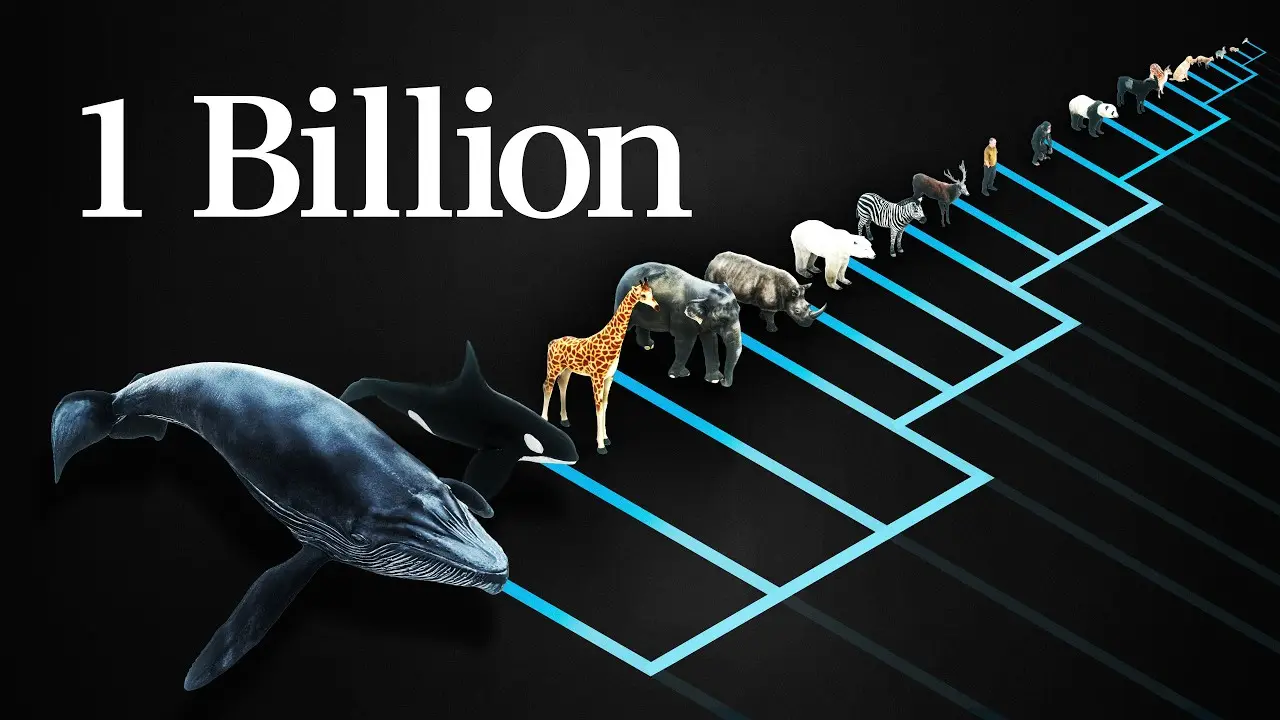
The video begins with the story of Tusko, an Indian elephant at Lincoln Park Zoo in Oklahoma. In the 1960s, as part of the CIA’s secret MKUltra program, researchers wanted to test whether LSD could cause changes in behavior. Since the safe dose for cats was about 0.3 milligrams, they assumed that an elephant with a thousand times their mass would need a dose a thousand times larger. They gave him nearly 300 milligrams of LSD. Within five minutes, Tusko trumpeted, collapsed, fell onto his right side, defecated and went into status epilepticus; shortly afterward, he died. The mistake was assuming that a safe drug dose scales linearly with mass, which it does not.
From there, the video moves on to a puzzling pattern: almost all mammals, from the Etruscan shrew, the smallest mammal by mass, to the African elephant, the largest land mammal, have about one billion heartbeats over their lifetimes. The same is true of the wallaby and the two-toed sloth. Regardless of their environment, size or whether they live for one year or a hundred, mammals end up at this number. The video draws heavily on Geoffrey West’s book “Scale.”
The key lies in metabolic rate, meaning the calories an organism uses over a given period. A cat needs about 250 kilocalories a day. The cells of a cat and an elephant are similar in size and function, so an elephant with a thousand times the mass has about a thousand times as many cells. The naive prediction is that it would need a thousand times as much energy, or 250,000 kilocalories a day. But if heat production were a thousand times greater while the surface area through which heat escapes increased only a hundredfold, the elephant would boil alive. That is why, in 1838, French scientists proposed that metabolic rate scales in proportion to surface area, giving an exponent of two-thirds.
The video uses a cooking analogy to explain this relationship: if you double the weight of a roast, you do not need to cook it for twice as long, but for about 60% longer, because the time it takes heat to diffuse scales with thickness. Steven Strogatz expresses this as a power law: time scales as mass raised to the two-thirds power. On a log-log plot, power laws become straight lines, with a slope equal to the exponent. A slope of one means linear scaling, less than one means sublinear scaling, and greater than one means superlinear scaling.
In 1932, Swiss biologist Max Kleiber measured metabolic rates in animals ranging from a small, 150-gram pigeon to a large, 680,000-gram ox. The points fell along a straight line, but the slope was not two-thirds; it was about three-quarters. This became known as Kleiber’s law. It means that if mass doubles, metabolic rate increases by about 68% rather than 59%. For the elephant, the correct LSD dose would have been about 53 milligrams, roughly one-sixth of the dose Tusko received. The same three-quarter pattern also appears in birds, reptiles and fish, although warm-blooded animals have a higher basal metabolic rate than cold-blooded animals.
This raises the question of why the cells of a large animal use proportionally less energy per cell, as though there were an efficiency advantage to being large. Researchers also noticed that many other properties scale in quarter powers: a mammal’s lifespan is proportional to mass raised to the one-quarter power, as is the time it takes blood to circulate, while breathing rate and heart rate scale with an exponent of negative one-quarter. The question was where these exponents came from.
As an undergraduate, Brian Enquist became fascinated by scaling charts and decided to study the subject for his PhD under James Brown. Through the Santa Fe Institute, they met theoretical physicist Geoffrey West. The three developed WBE theory, named after their initials. They began with three assumptions: resource distribution networks fill space because they must reach every cell, the terminal vessels have the same width regardless of the organism’s size, and evolution has led these networks toward an efficient design.
The theory describes how an efficient network of blood vessels branches. Instead of many parallel routes that waste material and blood, nature favors structures that minimize reflections of blood at branching points. This happens when cross-sectional area is preserved before and after a branch, at least in large vessels; in smaller ones, the daughter vessels may be slightly wider so that blood slows down and exchanges resources with tissues. The result is a branching, self-similar fractal.
This is where the concept of Hausdorff dimension comes in. A straight line segment has a dimension of one, but if you bend it enough, it can fill a surface and acquire a dimension of two. Similarly, a two-dimensional surface crumpled at ever smaller scales can fill a volume and acquire a dimension of three. Brian Enquist explains that this fractal structure allows an organism to pack enormous metabolic surfaces into a given size. As a result, the surface area of the circulatory system scales as length to the third power, rather than the second.
This provides an explanation for Kleiber’s law. Since every cell must be served by the network, the volume around the network is proportional to the animal’s mass. Because volume equals surface area times length, and surface area scales as length cubed, volume and mass scale as length to the fourth power. Therefore, length scales as mass to the one-quarter power, and metabolic rate as mass to the three-quarter power, exactly as Kleiber had found. WBE theory was published in 1997 and makes 26 specific predictions, such as that the radius of the aorta scales with an exponent of 0.375 and lung surface area with about 0.92. The observed values are 0.36 and 0.95, which Steven Strogatz calls impressive.
Other relationships also follow from metabolic rate. Heart rate equals blood flow divided by the volume of blood per beat, and thus scales as mass to the negative one-quarter power. The smallest shrew has a heart rate of 1,200 beats per minute, while an elephant’s is just 30. According to the theory of accumulated metabolic damage, lifespan is inversely proportional to the rate of damage per unit of mass and scales as mass to the one-quarter power. The shrew lives for one to two years in the wild, while the elephant lives for up to seventy. When you multiply heart rate by lifespan, the exponents cancel out, leaving a constant: about one billion heartbeats.
The major exception is humans. Three centuries ago, humans were much closer to one billion heartbeats. From the mid-19th century onward, germ theory and improvements in hygiene drastically reduced child mortality and deaths from disease. Despite dips caused by the Spanish flu in 1918 and the Second World War, the trend is clear: the average human now reaches nearly three billion heartbeats. The video presents this as one of the strongest arguments for science and technology, which have given humans more than one extra lifetime. Other mammals also live longer in captivity, away from the dangers of the wild.
The same kind of analysis is also applied to cities. A chart of life expectancy looks strikingly similar to a chart of the number of people living in cities, although this does not prove causation. Geoffrey West and colleagues such as Luís Bettencourt found that crime scales superlinearly with an exponent of about 1.15: each doubling of the population brings about 120% more crimes. The same pattern holds for sewage and AIDS cases. As early as 1889, a doctor was describing the “poisonous germs and pollution of the city,” dirty water, poor sewers and endless disturbances.
WBE theory is not undisputed.
The video concludes that scaling laws are real and that life is not always linear. Large animals are more energy-efficient. From the surface area law to Kleiber’s law and WBE theory, how metabolism scales with mass remains one of biology’s great debates.




Comments